Did you know that you can navigate the posts by swiping left and right?
Central limit teorem animation in R
01 May 2016
. category:
R
.
Comments
#R
#Animation
#Plot
I am not a matematician. I have, however, to teach my students about some important teorems in our statistics course. One of this teorems is the Central Limit Teorem.
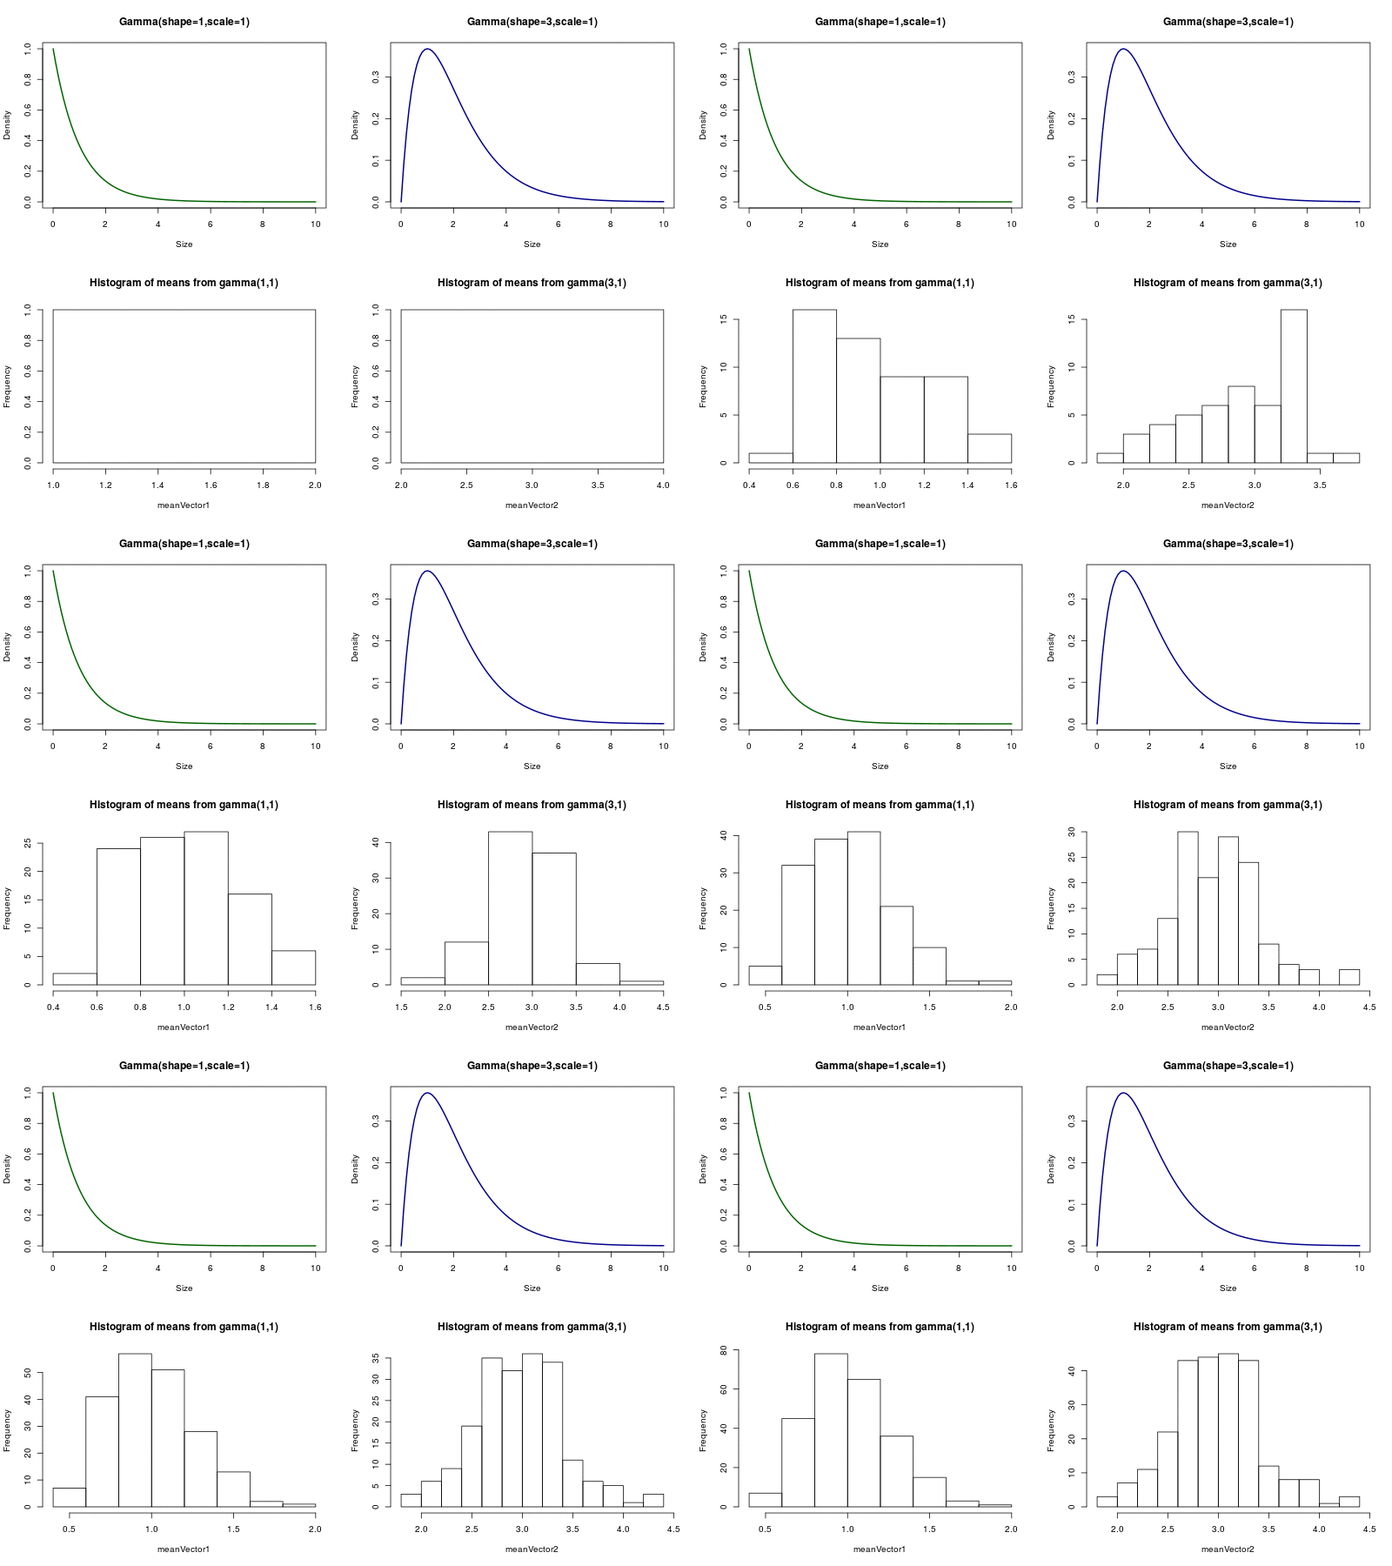
I ussually do this using an animation I created using the R package ‘animation’. The code goes:
#you need the package animation
library(animation)

#sample 15 data points from a gamma with shape=1 and scale=1
meanVector1<-c(mean(rgamma(15,1,1)))

#sample 15 data points from a gamma with shape=3 and scale=1
meanVector2<-c(mean(rgamma(15,3,1)))

saveGIF({
  #animation options
  options<-ani.options(nmax=250)

  for(i in 1:ani.options("nmax")){

    #split the layout in four
    par(mfrow=c(2,2))

    #plot the generating distributions
    plot(function(x) dgamma(x, 1, 1), 0, 10, main="Gamma(shape=1,scale=1)", ylab="Density", xlab="Size", col="dark green", lwd=2)
    plot(function(x) dgamma(x, 2, 1), 0, 10, main="Gamma(shape=3,scale=1)", ylab="Density", xlab="Size", col="dark blue", lwd=2)

    #plot the histograms of the means of the sampled values
    hist(meanVector1, main="Histogram of means from gamma(1,1)")
    hist(meanVector2, main="Histogram of means from gamma(3,1)")
    ani.pause()

    #sample again and append the value to the corresponding vector
    meanVector1<-c(meanVector1, mean(rgamma(15,1,1)))
    meanVector2<-c(meanVector2, mean(rgamma(15,3,1)))
  }
}, interval=0.2, movie.name = "Central_Teorem.gif", ani.width=800, ani.height=600)
you will have an animated gif (i.e. Central_Teorem.gif) looking like this:

